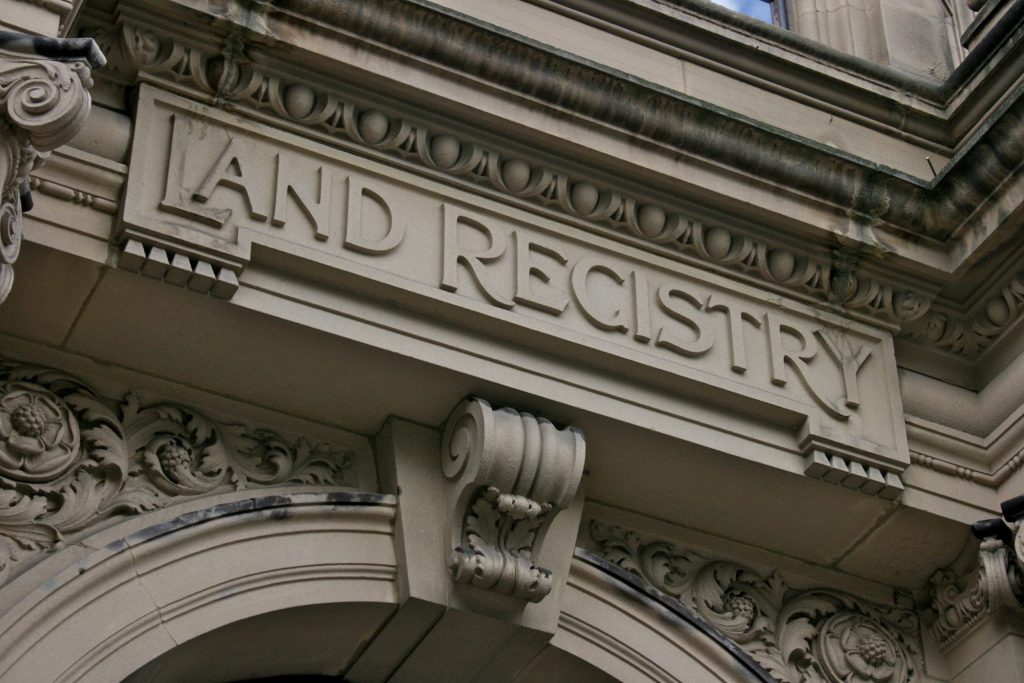
Land Registry Figures Analysis by HomeOwners Alliance
The figures and vital statistics that indicate the trend of the housing market in our Brexit situation have been gathered together from the Office for National Statistics (ONS) by the Land Registry and then sorted, collated and summarized by the HomeOwners Alliance.
The overall correlation that the HomeOwners Alliance has found about the impact of Brexit on the housing prices in this country is rather striking and indicative of the divisiveness of the debate that culminated in the events of June 2016. It has been found that the areas that voted the most fervently to leave the European Union saw the greatest rise in the price of homes, whilst on the other hand homes in the most fervent “Remainer” areas saw the greatest slump in house prices.
For example, areas in the West Midlands (of which 59.2 per cent voted to leave) saw the largest rise in home price percentages within the last half of the year since the referendum vote, which is currently leveled at a 3.57 per cent increase. In total contrast, Scotland, the area of the United Kingdom that voted most fervently to stay within the European Union with a 62.1 percentage voting to stay saw a 1.2 per cent decrease in the price of its properties in the land. This clearly shows that the areas with greater confidence that the United Kingdom would fare better without its attachment to the EU has had a positive impact on the housing market in those particular areas.
Conversely, areas such as Scotland and London have seen property prices slump or not increase as much as areas that voted to leave. On the other hand, the situation of the property market in London clearly shows that the Brexit vote has not changed the rising prices of properties as significantly as it might have done: despite 60 per cent of Londoners voting to remain, the house prices still went up in the last six months by 2.45 per cent.


