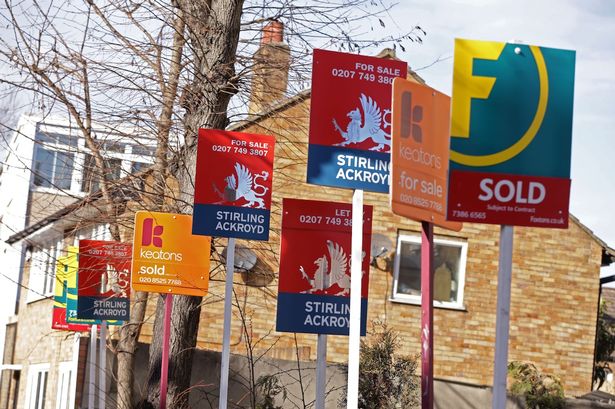
British Rental Prices Up 2.5% Year on Year : Rents in Britain increased by 2.5% in the 12 months to May, down slightly from the 2.6% annual rise recorded in the previous month, the latest index figures show.
Rental prices grew by 2.6% in England, 0.4 % in Scotland and were unchanged in Wales, the data from the Index of Private Housing Rental index published by the Office of National Statistics also shows.
It means that a property that was rented for £500 a month in May 2015, which saw its rent increase by the Great Britain average rate, would be rented for £512.50 in May 2016.
Rental prices for Great Britain excluding London grew by 2% in the same period and rental prices increased in all the English regions over the year to May 2016, with rental prices increasing the most in the South East at 3.4%, up from 3.1% in April 2016.
This was followed by London at 3.3 but this was down from 3.7% in April 2016 and the East of England at 3.2%, up from 3.0%. Annual price increases had previously been stronger in London than the rest of England since November 2010. I
The lowest annual rental price increases were in the North East at 0.8%, unchanged when compared to April 2016, the North West at 1.2%, up from 1.1% and Yorkshire and the Humber at 1.2%, down from 1.3% over the same period.
The zero annual rate of change in Wales continues to be below that of England and the Great Britain average. Rental growth in Scotland has gradually slowed to 0.4% from a high of 2.1% in the year to June 2015.
The IPHRP series for England starts in 2005. Private rental prices in England show three distinct periods: rental price increases from January 2005 until February 2009, rental price decreases from July 2009 to February 2010, and increasing rental prices from May 2010 onwards. When London is excluded, England shows a similar pattern but with slower rental price increases from around the end of 2010.
Since January 2011 England rental prices have increased more than those of Wales and Scotland and since the beginning of 2012, English rental prices have shown annual increases ranging between 1.4% and 3% year on year, with May 2016 rental prices being 2.6% higher than May 2015 rental prices. Excluding London, England showed an increase of 2.3% for the same period.
Looking at data from the UK House Price Index over a longer period shows residential house price growth has typically been stronger than rental price growth for a number of years, with an average 12 month rate of house price inflation of 5.7% between January 2013 and April 2016, compared with 2.1% for rental prices.
Inflation in the rental market is likely to have been caused by demand in the market outpacing supply. Demand in the lettings market continues to strengthen, with RICS’ Residential Market Survey noting that tenant demand continued to grow robustly in May 2016.
The strength in demand is in contrast to supply. The latest RICS survey found supply growth was broadly stable in May 2016, with demand in the lettings market outstripping supply for 30 consecutive months. The Association of Residential Letting Agents (ARLA) also reported that supply in April 2016 fell compared with April 2015. However, they highlighted regional patterns in conditions, for example, in Scotland demand was reported to be weaker and supply was amongst the strongest of the regions.


