Four years can be a long time in sport, politics… and house prices. When the last Euros took place in June 2012 Fabio Capello had not long resigned, Leicester City were in the Championship, the Lib Dems in coalition, and few would have predicted that house prices in Turkey, Ireland and Sweden would be about to embark on a period of prolonged growth.
A huge 74 percent of competing countries in the Euros have seen house price growth since the last competition but who are the winner and losers?
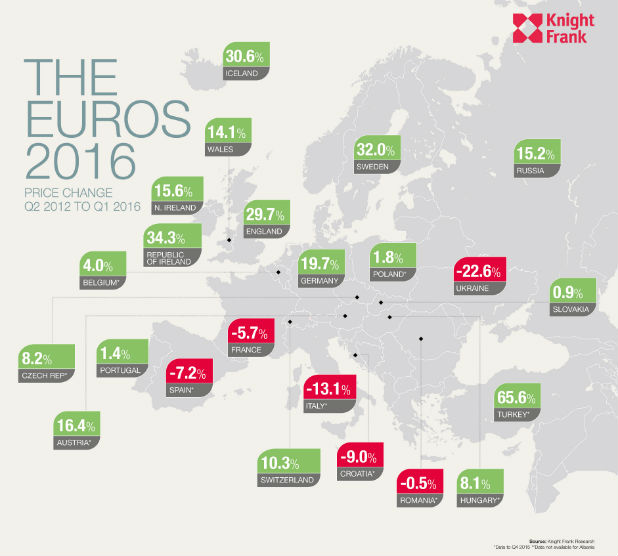
The map below, created for us by estate agents Knight Frank, shows the change in mainstream house prices since the last tournament.
The divergent performance of northern and southern Europe is evident. The Nordic countries along with Ireland, England and Germany have seen prices accelerate while prices in most of the southern European economies still sit below their level in 2012.
| Top 5 winners | Top five losers | ||
| 1. Turkey | 65.6% | 1. Ukraine | -22.6% |
| 2. Republic of Ireland | 34.3% | 2. Italy | -13.1% |
| 3. Sweden | 32.0% | 3. Croatia | -9.0% |
| 4. Iceland | 30.6% | 4. Spain | -7.2% |
| 5. England | 29.7% | 5. France | -5.7% |
Taimur Khan, senior analyst, at Knight Frank, said: “Since Euro 2012 property prices in England have increased by 29.7 percent supported by record low interest rates and strong economic growth, keeping the cost of borrowing low and boosting confidence in the market respectively. During the same time period Nottinghamshire has seen prices increase by 20.7 percent, outperforming the East Midlands region which saw price growth of 15.7 percent.”
So, while the hosts, France, are favourites to win the football, they are perhaps not so fortunate with their house prices – here house prices are 6 percent below their 2012 level but they have reached their floor with growth of 0.5 percent recorded over the last 12 months.


